
Core Summary
This page focuses on thermal stress cracking, one of the most common and frequently misdiagnosed CVD coating failure modes. Starting from the interfacial residual-stress model, it explains why cracks preferentially nucleate at edges and corners, introduces the “temperature bifurcation point”—the cooling-rate/ΔT combination beyond which crack probability rises sharply—and closes with three practical engineering countermeasures and a field case involving cooling-profile optimization.
Author: Dr. Zhang, Senior Engineer, Semicera Semiconductor Materials
When investigating coating failures, customers often first ask whether the coating material itself is the problem. However, across dozens of failure cases we have reviewed, nearly 70% of crack initiation points were located at edges or corners rather than planar areas. This is not accidental; it is governed by mechanics.
1. A Field Question: Why Do Cracks Always Start at the Edge?
When failed coated parts are inspected together, a consistent pattern appears: regardless of whether the substrate is graphite or SiC, and whether the coating is SiC or TaC, crack initiation points are concentrated around edges, chamfers, and holes. Planar regions are much less likely to act as crack sources. This indicates that cracking is not purely a material-strength issue; it is strongly related to stress distribution. Local stress at an edge can be much higher than the average nominal stress.
It is therefore important to distinguish nominal stress from actual edge stress. Nominal stress is the average value obtained from a simplified engineering model, while the actual local stress determines whether a crack will initiate.
2. Where Does the Stress Come From? A Mechanical Model of Residual Thermal Stress
Because the coating and substrate cannot have exactly the same coefficient of thermal expansion (CTE), and CVD deposition occurs at high temperature followed by cooling to room temperature, residual thermal stress accumulates at the coating–substrate interface. A commonly used one-dimensional approximation is:
σ ≈ E · Δα · ΔT / (1 − ν)
σ: interfacial residual stress; E: coating elastic modulus; Δα: CTE difference between coating and substrate; ΔT: temperature change; ν: Poisson’s ratio.
- · Stress is proportional to Δα. If the CTE difference is reduced by half, interfacial stress is approximately halved. Therefore, substrate grade selection—especially orientation selection for anisotropic graphite—is itself a service-life optimization measure.
- · Stress is proportional to ΔT. Rapid cooling is more likely to induce cracking than simply holding at a high temperature. This is why some failures initially attributed to “excessive temperature” are found during investigation to be related to an overly aggressive cooling rate.
The equation gives nominal stress in a uniform region away from boundaries. Actual crack initiation, however, usually occurs at edges, leading to the question of why local edge stress is significantly higher.
3. Why Are Edges Stress-Concentration Zones?
Edge stress concentration results from the combined effects of geometry and microstructure.
- · Free-boundary stress singularity: where two materials with different stiffness and CTEs intersect at a free boundary, a theoretical stress singularity can occur. The nominal stress equation no longer accurately describes the local field, and actual stress can be much higher than the internal average.
- · Geometric curvature effect: the local radius at coating corners and chamfers is much smaller than on planar regions. The smaller the radius, the higher the local stress-concentration factor.
- · Columnar grain-boundary effect: CVD SiC coatings commonly exhibit a columnar grain structure. Grain boundaries can act as stress-concentration points and weak paths; surface facets can further amplify local stress around corners.
- · Crack-propagation pattern: once a crack nucleates at an edge, it tends to propagate along columnar grain boundaries rather than through grains. Under optical inspection, this can produce a branched appearance rather than a straight line, helping distinguish thermal-stress cracking from mechanical impact damage.
Engineering inspection recommendation: first check whether crack initiation is concentrated at edges, holes, or chamfers; then check whether cracks show branched, grain-boundary-following propagation. If both features are present, thermal stress should be considered a primary failure mechanism, and the cooling profile and edge design should be reviewed before assuming a material-batch issue.
4. The Temperature Bifurcation Point: The Critical Relationship Between Cooling Rate and Stress Accumulation
It is tempting to treat cracking as a linear problem: larger ΔT and faster cooling simply produce a proportionally higher cracking probability. Field observations suggest a more useful description: a “bifurcation point” exists. Below a critical cooling rate, crack probability increases gradually with ΔT. Once the cooling rate exceeds a critical range, cracking probability can rise sharply within a narrow parameter window, showing threshold-like behavior rather than a smooth curve.
The physical reason is that the residual-stress equation assumes quasi-static conditions. During actual cooling, heat-transfer delay between the coating and substrate creates transient temperature differences. The faster the cooling, the larger the transient temperature difference between the coating surface and the substrate interior, increasing additional stress on top of the steady-state residual stress. Once the cooling rate exceeds the range that the material’s thermal diffusion can accommodate, transient stress can increase rapidly.
Rather than attempting to calculate a universal bifurcation-point value—which requires material thermal diffusivity, coating thickness, furnace structure, and other parameters for finite-element modeling—a practical approach is stepwise cooling-rate testing. Keep other parameters fixed, gradually increase the cooling rate, and track crack density or particle count to identify the actual turning-point range for the specific furnace and coating batch. Set the safe cooling rate below this point with an appropriate margin.
5. Case Study: Reducing Cracking Through Cooling-Profile Optimization
A SiC epitaxy customer reported a high proportion of edge cracking in coated trays during mid-to-late service life. Average failure-free process cycles were only about 60% of those on comparable production lines. Material-batch issues were first ruled out: GDMS purity and thickness-uniformity sampling for the same coating batch were both qualified, pointing the investigation toward the process.
Review of the equipment cooling profile showed that the line had adopted a relatively high cooling rate after processing to increase throughput. The average cooling rate from peak temperature to 400°C was significantly faster than the recommended safe range. We recommended a two-stage adjustment: retain the original rate from peak temperature to 800°C, where both substrate and coating still have relatively good high-temperature ductility; below 800°C, reduce the cooling rate by approximately one third, where residual stress accumulates rapidly and material brittleness increases.
After several production cycles of tracking, the proportion of edge crack initiation decreased noticeably and average tray life recovered toward the level of comparable lines. The customer also reported no significant increase in total cycle time because only the low-temperature cooling slope was changed, leaving high-temperature efficiency unaffected. This case indicates that segmented cooling-profile design can be more cost-effective than simply slowing the entire cooling process.
6. Engineering Countermeasures: Substrate Selection, Cooling Profile and Thickness Gradient
- · Substrate selection and orientation: prioritize substrate grades whose CTE is closer to that of the coating. For anisotropic graphite, consider the effect of orientation on CTE and avoid aligning the high-stress direction with the coating’s principal load direction.
- · Segmented cooling-profile design: identify the bifurcation range for the specific furnace and actively reduce the cooling rate in the medium- and low-temperature range where residual stress accumulates rapidly. The high-temperature section can retain its original efficiency.
- · Edge and corner design: increase the radius of edge chamfers where possible, reduce sharp corners and dense hole regions, and thereby lower the geometric stress-concentration factor. Local thickening or transition fillets may be considered around holes and slots.
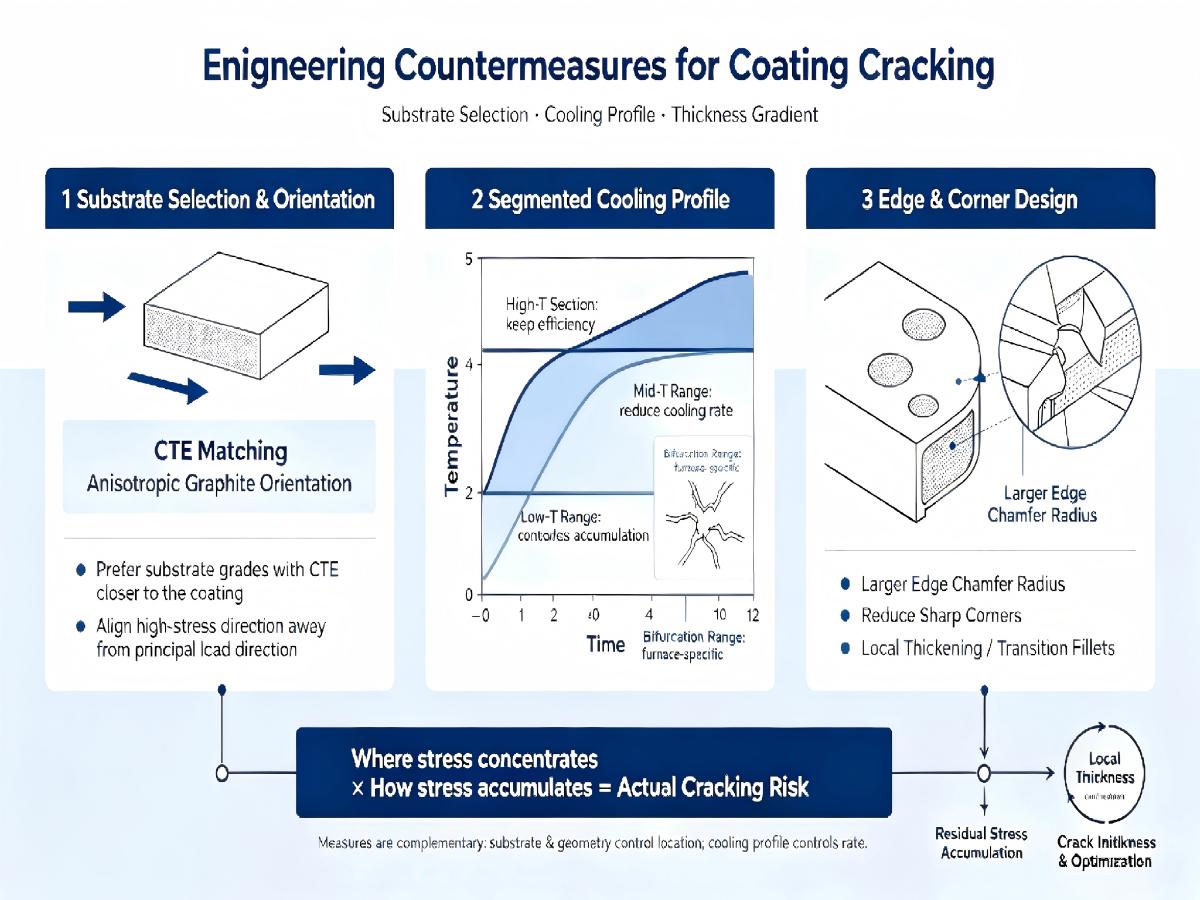
These measures are complementary. Substrate and structural design address where stress concentrates, while the cooling profile controls the rate at which stress accumulates. Together they determine the actual cracking risk.
FAQ
Q1: How can I quickly determine whether coating cracks are caused by thermal stress or mechanical impact?
Check two features: whether crack initiation is concentrated at edges, holes or chamfers, and whether the cracks propagate in a branched pattern along grain boundaries. If both are present, thermal stress is likely dominant. Straighter cracks or obvious impact dents should prompt investigation of handling and transport damage.
Q2: Is there a universal cooling-rate value for the temperature bifurcation point?
No. The bifurcation point depends on coating thickness, material system, substrate geometry and furnace heat-transfer conditions. Safety ranges can differ substantially between production lines. Stepwise cooling-rate tests on the actual equipment are recommended rather than directly copying parameters from another line.
Q3: Does making the coating thicker reduce cracking risk?
Not necessarily. Increasing coating thickness does not significantly change the stress term itself; residual stress is mainly governed by CTE mismatch and ΔT rather than a simple linear relationship with thickness. However, an overly thick coating stores more strain energy, so crack propagation can have a greater driving force once a local crack forms. Local thickness optimization around stress-concentration areas is generally more appropriate than simply increasing overall thickness.
Q4: What is the difference between surface microcracks and through-thickness cracks in coatings, and how do they affect service performance?
Q5: Can post-coating heat treatment eliminate residual stress and prevent coating cracking completely?
Post time: Sep-21-2026